Smart Token Bonding Curve

The definition of the bonding curve model is a specific type of smart-contract that issues its own tokens through Buy and Sell functions. To buy tokens, the buyer sends the payment tokens to the Buy function which calculates the average price to pay and issues the right amount of tokens. To sell tokens, the contract will work in reverse by calculating the amount of payment tokens to send to the seller and the Sell function will burn the selling tokens in return. Learn more
MINT token calculations for buying/selling smart tokens
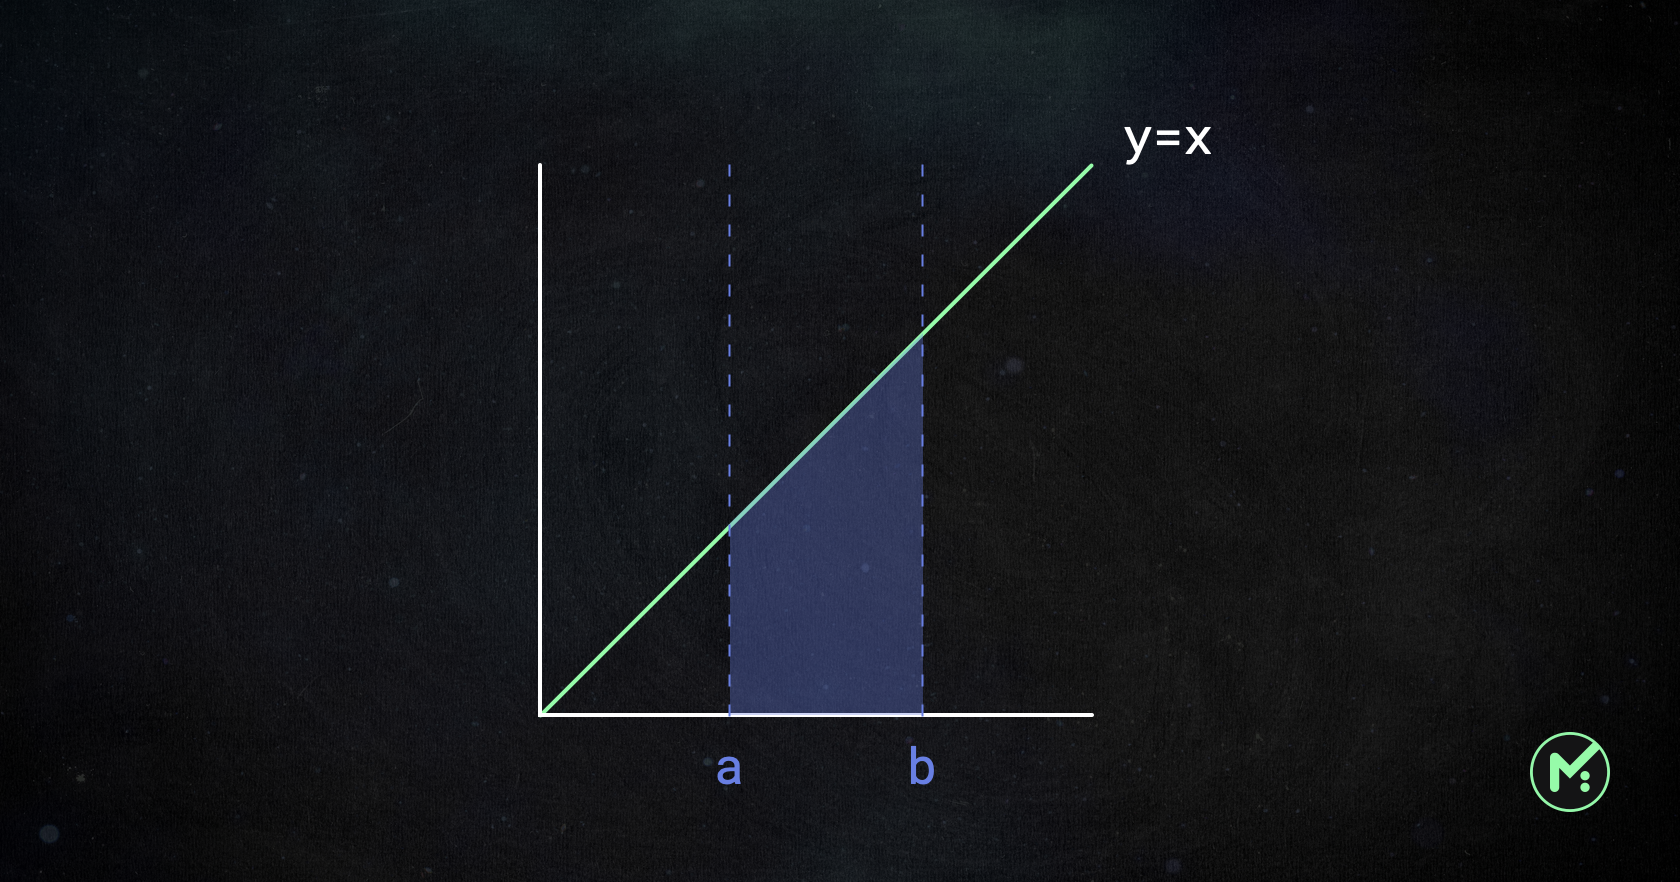
In the Mint Club protocol, the most simple bonding curve Price = Total Supply (y = x) is used.

When the current token supply is a and a buyer tries to purchase a up to the b supply (the amount of tokens the persons buys = b - a), the amount of MINT tokens is calculated as below:
This simple equation is just to calculate the differences between the two triangle areas. By using this, we can get the Sell and Buy functions as below:
totalSupply = price collateralBalance = 1/2 * totalSupply^2
When to buy a smart token:
tokensToBeMinted = √ (2 * (amountPaid + collateralBalance)) - oldTokenSupply
When to sell a smart token:
amountToRefund = collateralBalance - 1/2 * (oldTokenSupply - sellingTokenAmount)^2
→ These calculations don’t include the referral fee charging metrics.
The price of the smart token relies on the price of the MINT token because the MINT tokens that are bonded in the contract (collateralised asset) back the value of the market cap of the smart token.
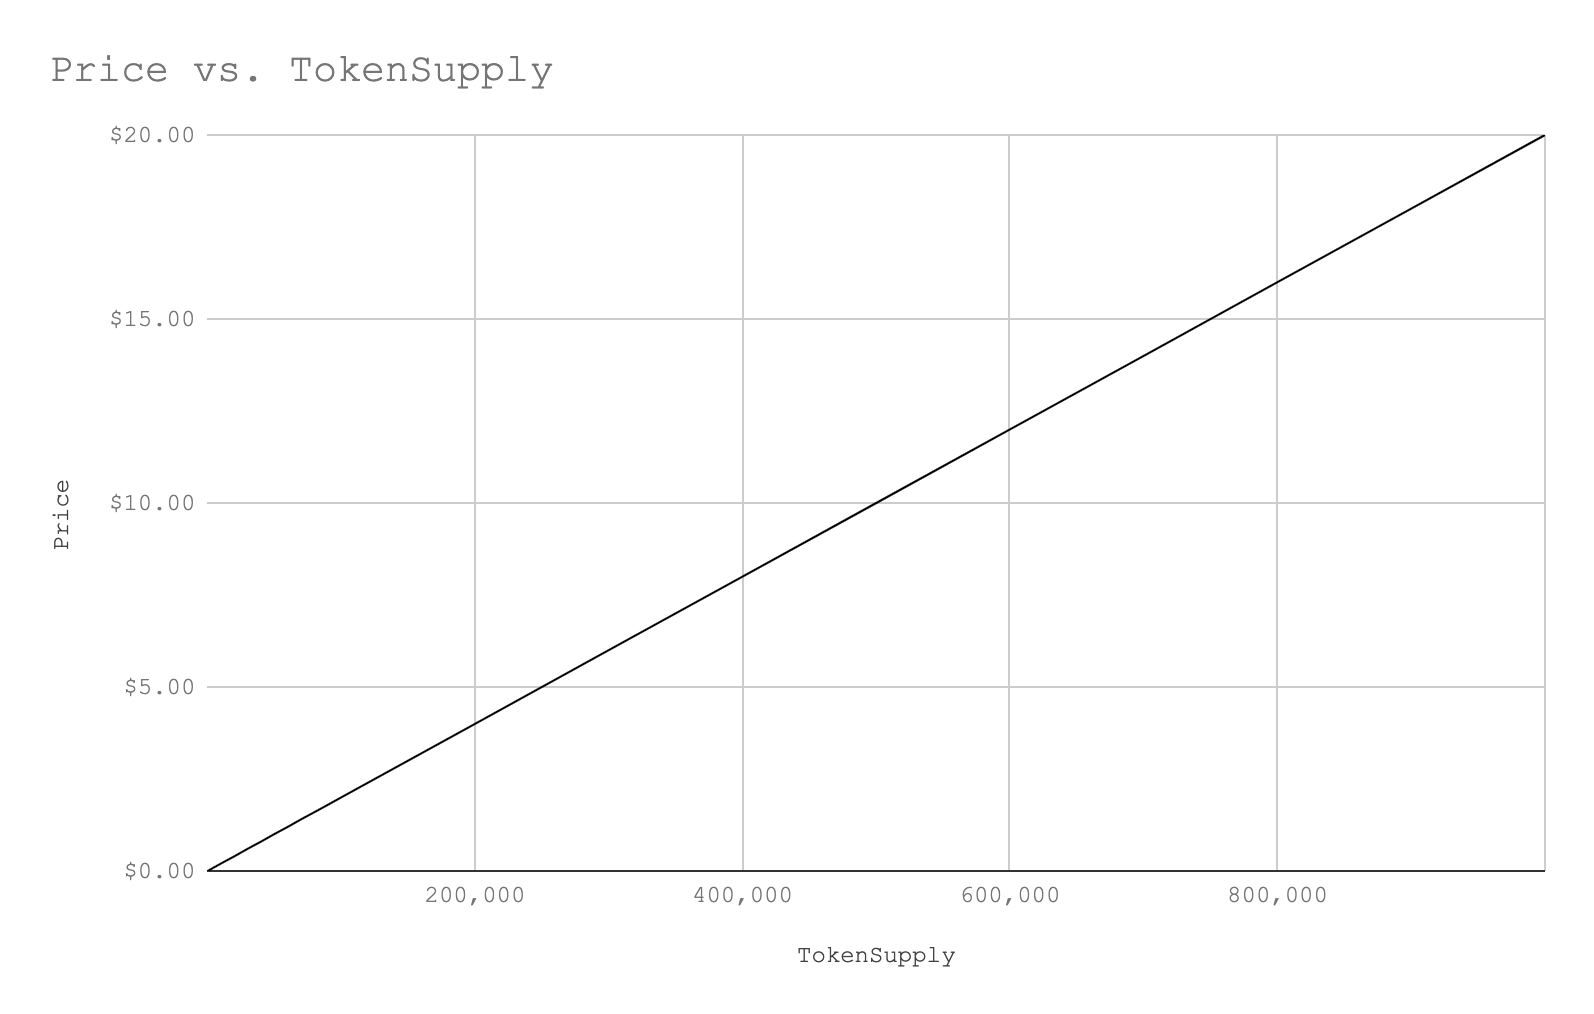
For example, let’s assume that the USD price of 1 MINT = $0.00002. In this case, the price chart of smart tokens will look like this.

Price scenario for each token supply (when 1 MINT = $0.00002):
1
1
1
$0.00
$0.00
100
100
5,000
$0.00
$0.10
1,000
1,000
500,000
$0.02
$10.00
2,000
2,000
2,000,000
$0.04
$40.00
3,000
3,000
4,500,000
$0.06
$90.00
4,000
4,000
8,000,000
$0.08
$160.00
5,000
5,000
12,500,000
$0.10
$250.00
6,000
6,000
18,000,000
$0.12
$360.00
7,000
7,000
24,500,000
$0.14
$490.00
8,000
8,000
32,000,000
$0.16
$640.00
9,000
9,000
40,500,000
$0.18
$810.00
10,000
10,000
50,000,000
$0.20
$1,000.00
20,000
20,000
200,000,000
$0.40
$4,000.00
30,000
30,000
450,000,000
$0.60
$9,000.00
40,000
40,000
800,000,000
$0.80
$16,000.00
50,000
50,000
1,250,000,000
$1.00
$25,000.00
60,000
60,000
1,800,000,000
$1.20
$36,000.00
70,000
70,000
2,450,000,000
$1.40
$49,000.00
80,000
80,000
3,200,000,000
$1.60
$64,000.00
90,000
90,000
4,050,000,000
$1.80
$81,000.00
100,000
100,000
5,000,000,000
$2.00
$100,000.00
200,000
200,000
20,000,000,000
$4.00
$400,000.00
300,000
300,000
45,000,000,000
$6.00
$900,000.00
400,000
400,000
80,000,000,000
$8.00
$1,600,000.00
500,000
500,000
125,000,000,000
$10.00
$2,500,000.00
600,000
600,000
180,000,000,000
$12.00
$3,600,000.00
700,000
700,000
245,000,000,000
$14.00
$4,900,000.00
800,000
800,000
320,000,000,000
$16.00
$6,400,000.00
900,000
900,000
405,000,000,000
$18.00
$8,100,000.00
1,000,000
1,000,000
500,000,000,000
$20.00
$10,000,000.00
Why we use the linear rather than exponential curve
Mint Club’s price bonding curve follows the linear curve rather than the exponential curve. There are pros and cons for each curve type.
Curve Type
Pros
Cons
Linear
Simple and easy to understand
Less impact from token pumping/dumping
Lower ROI for the early-token holder
Exponential
Higher ROI for the early-token holder
Vulnerable to token pumping/dumping
The exponential curve is often chosen to provide higher benefits for the early token holders because the token price increases more steeply later. But the downward price impact is huge when early holders suddenly sell out a large amount of tokens. This curve type is vulnerable to the pump/dump scheme by promoting FOMO (fear of missing out).
On the other hand, the price impact on the linear curve is relatively smaller than the one on the exponential curve, so it is less likely to suffer the rug-pulling attack. This can also reduce the motivation of early-backers of the token because of the smaller ROI. However, the good news is that in Mint Club all smart tokens are backed by MINT token based on their collateral contracts. This means that all smart token prices can exponentially increase when the MINT price goes up. We believe that this MINT-based valuation can strengthen the motivation of the early-backers.
Max supply of each smart token
Each smart token can set a max supply of the token, which means that it can set the maximum amount of tokens to be minted on the Mint Club bonding curve. The max supply that each token can set is 1 million tokens. If the number of minted tokens actually reaches 1 million, a total of 500 billion MINT tokens should be locked in the collateral contract. This is about 43% of the total MINT supply.
When a smart token reaches the max supply, token minting will no longer be possible on Mint Club, meaning that the current circulating supply can become the fixed supply. In this case, it will be easier for the token to be listed in DEX platforms such as PancakeSwap. The MINT tokens locked in its collateral contract can work as a base market cap and token holders can continue the trading on the DEX platform.
When a smart token has a liquidity pool of both Mint Club and DEX, there will be the arbitrage trading opportunity between two different pools, and the volatility can be eased because of the extended liquidity pools.
Smart token price vs circulating supply
In Mint Club, all smart tokens have the same price bonding curve which means that the performance of each smart token is comparable by its current token price. For example, the price of A token and B token is the same when their current circulating supply is the same, even if the supply of each smart token is different.
Thus, in Mint Club, the price differences show us the real valuation of each smart token, whereas usually in crypto currency the price difference between tokens doesn’t mean anything. For example, in Mint Club if the price of one token is higher than another, it means it’s more popular than the other.